Monday, May 16, 2016

Raster Modeling

Goal
The purpose of this lab was to gain experience with several raster geoprocessing tools. The final product should contain models for suitability and impact of sand mining. The tasks completed in this lab are...
  • Build a suitability model for sand mining
  • Build a risk model for sand mining
  • Combine results from above tasks to determine best locations for mining
Using the data downloaded in the earlier exercises along with the new tools learned throughout the course, suitable frac sand mining locations will be determined.
Methodology
The following methods were used to determine the suitability of the site criteria outlined below.


Site Criteria for Sand Mining Suitability:
  • Geology
  • Land Use Land Cover: Agricultural land use
  • distance to railroads
  • slope
  • water table criteria
Before moving further, environments and masks were set to allow for faster geoprocessing. Because the data is a limited portion of Trempealeau County (TC), the mask was set to a certain boundary to avoid running tools on the entire county without any data. Suitability for each set of criteria can be found in Table 1 in the results.


Geology
To determine the suitable geological characteristics for a frac sand mine it is important to know what formations are best. As specified in in the initial background post, the Jordan and Wonewoc formations are the best for frac sand mining. The first step was to add the geology feature class that was found in the Ex8 geodatabase. From here, it needed to be converted into raster format. From here, a reclassify was performed to rank the geology types by suitability. As seen in Table 1, Wonewoc and Jordan Formations got the highest ranking because they are most desirable while the others got ranked a 1 for being least desirable. A map was then created sowing the locations of the desirable geologic material for frac sand mining.


Land Use Land Cover
The land use and land cover types of the area are important in determining the ease of building a frac sand mine in certain locations. When determining the land use and cover type of the areas throughout TC, referring to the figure 1 aids in deciding ranks.


Based on this figure, the rankings (found in table 1) were created. Areas of developed land were ranked lower because it would be more difficult to remove man-made structures and would be potentially hazardous to neighboring areas. Forested areas and water were also ranked as a 1 because these are areas that would be unrealistic to mine from. Clearing forests would lead to many negative environmental effects and loss of habitat and scenery for the county. Shrublands, herbaceous areas, and cultivated cropland were ranked at a 2. These areas would be able to be transformed into a mining operation but because they are already being used for agricultural purposes it would be best to leave them alone. Finally, barren and pasture land were ranked at the highest suitability. Barren land would be easy to build and would not have to remove anything or cause a disturbance during construction process. Pastured land is often flat and has little vegetation to get in the way or have to remove, allowing it to be a suitable land type.


Results

Throughout the course of the exercise, the following table was created to show the rankings of the suitability of the criteria. Reasoning behind these rankings are found above in the methodology for each of the criteria.


Geology
 The following map shows the locations of highly suitable geologic material needed for frac sand mining operations.

Land Use Land Cover
The following map was created to determine the possible locations for the frac sand mine operation based on the land use and land cover of the specified areas.


Thursday, April 7, 2016

Data Normalization, Geocoding, and Error Assessment

Goals and objectives:
The purpose of this lab was to work with a poorly organized excel table and normalize it to be put into ArcMap. This lab also introduced the geocoding tool and allowed us to gain experience using it. The final objective is to compare our own geocoded results to those of our classmates and the actual locations of the mines. The objectives of the lab are laid out in Figure 1.

Figure 1: List of Objectives for this Lab


Methods:
Data Normalization
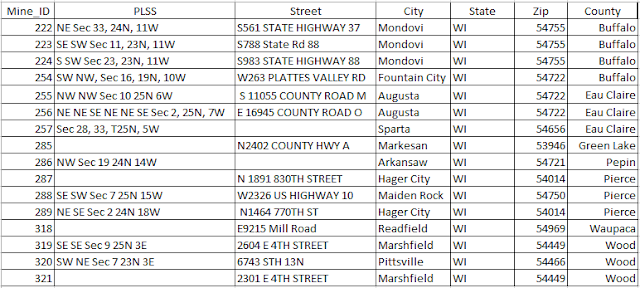
    After being given an excel table of frac sand mine locations in Wisconsin we had to prepare it to be put into excel. This is called normalization of data. It is the process of putting data into a general format that can be read by many different programs. In this case, our goal was to eventually put this table into ArcMap to be geocoded (Figure 2 and 3 show the table before and after normalization was completed). Each student was assigned a handful of mines to work with. The following steps were done on only these assigned mines.


Geocode
      This portion of the lab was completed in ArcMap. Geocoding is the process of assigning locations to addresses. This allows features to be portrayed accurately. To geocode, you open the geocoding tool bar and through the World Geocode Service you upload the normalized table. The software then assigns an address to the points. Looking at the interactive rematch inspector window, you are able to see the match score. The higher the score the more accurate the position. I only had two location that was a partial match.


 Locate PLSS Description
      After assigning the correct address for these locations, the next task was to select the mines that only had a Public Land Survey System (PLSS) location. PLSS is a method developed and used in the United States to divide land. Those mines with only a PLSS location are not accurate and therefore need to be corrected. From here, I then found the exact address and location with the help of Google Earth and assigned it to the mine. (Results shown in Figure 4)


  Compare the Results
       This portion of the lab was dedicated to assessing the error of our mine locations. To do so,  I first had to find the mines that I had location for by querying the Mine_ID field. I then created a new layer of these particular mines for my classmates' locations and then a layer of the actual locations provided to us. I then compared my mines to my classmates using the "Point Distance Tool". The error table can be seen in figure 4. Using the same tool, I then compared my mines to the actual locations of the mines (Figure 5).


Results:
Data Normalization
      Before normalization, the table provided to us included many unnecessary fields and multiple rows with no data. This would create an issue when importing the table to ArcMap. To fix this issue I determined what fields were needed in the project. These fields included: Mine_ID, PLSS, Street, City, State, Zip, and County. With this information ArcMap was able to geocode the mines accurately.

Figure 2: Table of mine information provided by the Wisconsin DNR before normalization.
Figure 3: Table of  mine location information created for geocoding purposed in ArcMap

Geocode/Locate PLSS Description
     The results of the automatic geocoding method along with the manual assignment of addresses for my portion of mines are shown below. At a glance the mine locations look correct, however, almost all of them were slightly inaccurate which is discussed further on. 

Figure 4:


Compare the Results
     The following tables reflect the amount of error between my geocoded mines and those of my peers (Figure 5) and the actual locations (Figure 6)


Figure 5: Error table between my mine locations and my peer's,
Figure 6: Error between my locations and the actual mine locations.

As one can see, there was some variation between my mine locations and those of my peers and the actual locations. However, the amount of error was smaller when comparing my portion of mine locations and actual locations of the mines. This leads me to believe that most of the error was from my peers geocoding rather than my own. For some mines there were large variances such as mine 257. The error almost reached 1 on both tables. This particular mine was difficult to find when determining the PLSS location and actual address which is why I believe it to be so high. Overall, my geocoded mines were fairly accurate which can be seen in figure 7. 
Figure 7: Comparison maps of my geocoded mine locations to my peers and the actual location. 


Discussion:
Error is something that will almost always occur when working with geographic data. Sources of this error include the original source maps, data automation and compilation, and data processing and analysis. There are two types of error that can occur from these sources when working with geographic data, inherent and operational error. Inherent error, as assumed, is embedded in the data itself. Often, this error is due to the generalization of features in a complex world. Operational error, on the other hand, is error that happen during operation and procedures. These are also known as user error or processing error.

Overall, my data error was larger when compared to my peers than when compared to the DNR. This could be explained with many reasons. To begin, there was definitely a large amount of human geocoding (operational) error. For the mines that only had a PLSS or did not completely match the assigned address we manually went in to find the correct one by looking at aerial imagery. This process of image interpretation can be difficult for users without experience and may have lead to error.

Another possible source of error is the data we were given. Because we were not given the field survey methods it is hard to completely trust that the data is accurate. There may be inherent errors with the data on the DNR's behalf.


Conclusion:
Geocoding is a very useful tool when it comes to importing and analyzing spatial data. However, when geocoding it is important to know the proper procedures. In this case, it was important to know about normalizing the given data table, how to match addresses to location of mines, and basic PLSS information. Geocoding is not a perfect form of locating addresses but when conducted with proper precaution you can minimize error and get very accurate results.


Friday, March 18, 2016

Gathering Data

Goals and Objectives:
The main purpose of this exercise was to gain practice in gathering online data. This data is needed for the semester long project regarding frac sand mining in Trempealeau County. This exercise also places importance on importing, joining, and projecting the data. Finally, the exercise allowed for experience in creating a geodatabase for all of the data to be stored.

General Methods:
To begin downloading data, I first created a new folder in my Q-drive labeled Ex_5. This allowed for better organization of all of the data. The data gathered in this exercise came from:

                            
                             US Department of Transportation
                             US Geological Survey- National Map Viewer
                             US Department of Agriculture
                             USDA NRCS Soil Survey
                             Trempealeau County Land Records 

 Each of the datasets were downloaded to a temporary folder in the department's Q-drive because of the large size of the unzipped datasets. From the temporary folder, the data was extracted to a working sub-folder within the Ex_5 folder. The data downloaded was then projected, joined, and added to a geodatabase through Python Script. This process can be seen in the blog post titled "Python Coding". The following maps of relevant data were then created in ArcMap (Figure 1). 
Figure 1: these four maps consist of relevant raster data for Trempealeau County, WI. Data was collected from various online sources. These sources can be seen below in "Sources".

Data Accuracy:
It is important when gathering data off of the internet to be confident in the data accuracy. This can be determined by looking at the metadata. Metadata should be found in the properties of every dataset and shows how accurate and reliable the data is. Important information in the metadata include its scale, effective resolution, minimum mapping unit, planimetric coordinate accuracy, lineage, temporal accuracy, attribute accuracy. This information can be seen in Table 1.


Conclusions:
The above data shows a wide array of accuracy and extents. It is important to know the type and accuracy of the information for this project because of the reliance on accurate features. In order to create accurate maps and analysis of frac sand mines and their impact on the Trempealeau County the data collected and used must be correctly displayed.


Sources:
US Department of Transportation-
http://www.rita.dot.gov/bts/sites/rita.dot.gov.bts/files/publications/national_transportation_atlas_database/index.html

USGS National Map Viewer-
http://nationalmap.gov/about.html


USDA Geospatial Data Gateway-
http://datagateway.nrcs.usda.gov/


Python Coding

Python

Python is an extensive computer coding language used in several programming software. In ArcGIS, python is used to organize and conduct geoprocessing. Using python allows for faster and more efficient geoprocessing procedures. 

Purpose

The purpose of this blog is to demonstrate the various python coding skills learned throughout the semester in GIS II. These python scripts will be used to work toward the semester long project regarding frac sand mining and the impacts it has on Trempealeau County, Wisconsin.

Python Script #1:
PyScipter, a python software, was used for this script. PyScripter allows for better organization compared to the python window found in ArcGIS. This python script shows the process of gathering 3 raster files (downloaded in part 1 of exercise 3 from various sources) and putting them into a geodatabase. The geodatabase is for data within Trempealeau County and is title "TMP.gdb". Once the files were ready to be put into the geodatabase, I began using pyscripter. To begin, I had to set the workspace environment and several variables to be used throughout the script. Within the script, I had to project the rasters by adding a file from a dataset in the geodatabase already. By doing this, the raster in question will adopt this dataset's projection. Next, I had to clip (extract by mask) the files with the Trempealeau county boundary. This allows for faster and more efficient geoprocessing. Finally, I moved the raster files into the geodatabase to be used in the remainder of the project.

Python Script #2:
This python script was created to prepare the data for network analysis in Exercise 7. Our goal was to determine the impact that transporting frac sand has on roads within the local area of the specific mine. The following perameters were set to calculate this impact.

  • The mine must be active.
  • The mine must not also have a rail loading station on-site. 
  • Mine must not be within 1.5 kilometers of a railroad
To begin, I set up the script and set the work space environment. I then set up the variables that would be used throughout the script. Using these variables, I wrote  several Structured Query Language statements to ensure the parameters were met. I then ran these statements to narrow down the amount of mines to be used. From here, I selected all of the mines within 1.5 km of the railroads and removed them from the selection. This left me with all of the mines that can be used later on in the exercise to conduct network analysis.


Thursday, February 25, 2016

Background of Frac Sand Mining in Wisconsin

What is Frac Sand Mining?
  Frac sand mining is the extraction of valuable frac sand, a specific type of quartz, that is used in the process of hydraulic fracturing. To understand the importance of frac sand and the mining of it one must understand hydraulic fracturing. Hydraulic fracturing, sometimes referred to as “fracking” is the process of gas and oil shale extraction from newly reachable depths. By fracturing the Earth’s crust at large depths openings are created for instruments to extract the shale. Frac sand, along with a mixture of other solutions such as water and carbon, is used as the main proppant within the fractures. Therefore, the importance of frac sand mining stems from the heavy reliance on oil and gas throughout the world.

Frac Sand Mining in Wisconsin
  In 2014, the United States lead the world in frac sand extraction with over 54 million metric tons of frac sand (D. Bleiwas, 2015). Nearly half of this came from the state of Wisconsin. Located in the central and western part of the state, Wisconsin contains over 135 active frac sand mines, processing plants, and transportation railways (Figure 1)(Walters et al., 2015). The process of frac sand mining takes place on sandstone formations from the Cambrian and Ordovician periods in the Paleozoic era. Formations from this period located in Wisconsin include the Jordan, Wonewoc, St. Peter, and the Mt. Simon formations (WDNR, p. 4). The biggest frac sand producing counties of Wisconsin are Chippewa, Trempealeau, Jackson, and Monroe. However, frac sand mining reaches as far north as Burnett county, as far west as Pierce County, and as far west as Waupaca County. Figure 1 show the dominant presence of frac sand mining throughout the state of Wisconsin.

Impacts of Frac Sand Mining
There are several negative consequences that result from frac sand mining operations. According to the Wisconsin Department of Natural Resources, there are various environmental impacts that frac sanding can lead to if proper precautions are not followed. The process of frac sand mining can have harmful effects on air. Dust from mining and handling of the sand and pollution from the heavy machinery can decrease the quality of the air. Frac sand mining also impacts the water resources in the areas near the mining sites. If located near a water system, the air pollutants can travel and settle in these open sources, runoff from the site, or pollutants may seep into the underground sources. The vulnerability of freshwater sources during the mining process can also have a negative effect on fisheries. Poisoned or polluted water can harm the biological life within these systems. Warm water runoff could increase water temperatures creating an unusual habitat for these animals.
This may lead to negative economic impacts as well due to the large presence fishing has in the state of Wisconsin. Because of frac sand mining, there is concern that there will be a burden put onto recreational lands. The frac sand mining operation comes with noise, air quality issues, dust, light during the night, and heavy traffic.  Traffic and other transportation impacts are a large concern for citizens of the area. The heavy loads of trucks for hours out of the day will lower the service life of the roads and harm the condition. Frac sand mining operations are often very large and that room comes with loss of forests and other types land cover. They are also not an appealing site. This comes with concern about overall unhappiness brought by the dominant frac sand mining operations.  

 Application of GIS on Frac Sand Mining Operations
This blog will be dedicated to the application of GIS software on frac sand Mining operations in Trempealeau County, Wisconsin. With GIS, we are able to map locations of sand mine facilities, processing stations, and other related destinations. Because of the many concerns regarding the impacts of Frac sand mining, we hope to gain a better understanding of the relationships between these locations and other features. We also are able to map routes for transportation and calculate the effects that the hard labor could have on the roads. With the tools learned in the introductory course and the new tools in this course we will be able to provide analysis on the factors regarding the frac sand mining operations.

References
D. Bleiwas, “Estimates of Hydraulic Fracturing (Frac) Sand Production, Consumption, and Reserves in the United States.". Accessed December 12, 2015. http://www.rockproducts.com/frac-sand/14403-estimates-of-hydraulic-fracturing-frac-sand-production-consumption-and-reserves-in-the-united-states.html#.Vmx7CPkrLIV).

Robertson, J.M., Frac Sand Mining in Wisconsin, 2016, Wisconsin Geological and Natural History Survey, Madison, Wisconsin

Silica Sand Mining in Wisconsin. Madison, Wisconsin: Wisconsin Dept. of Natural Resources, 2012.

Walters, K., J. Jacobson, Z. Kroening, and C. Pierce. "PM 2.5 Airborne Particulates Near Frac Sand                Operations." Journal of Environmental Health 78, no. 4 (2015): 8-12. doi:2015.